
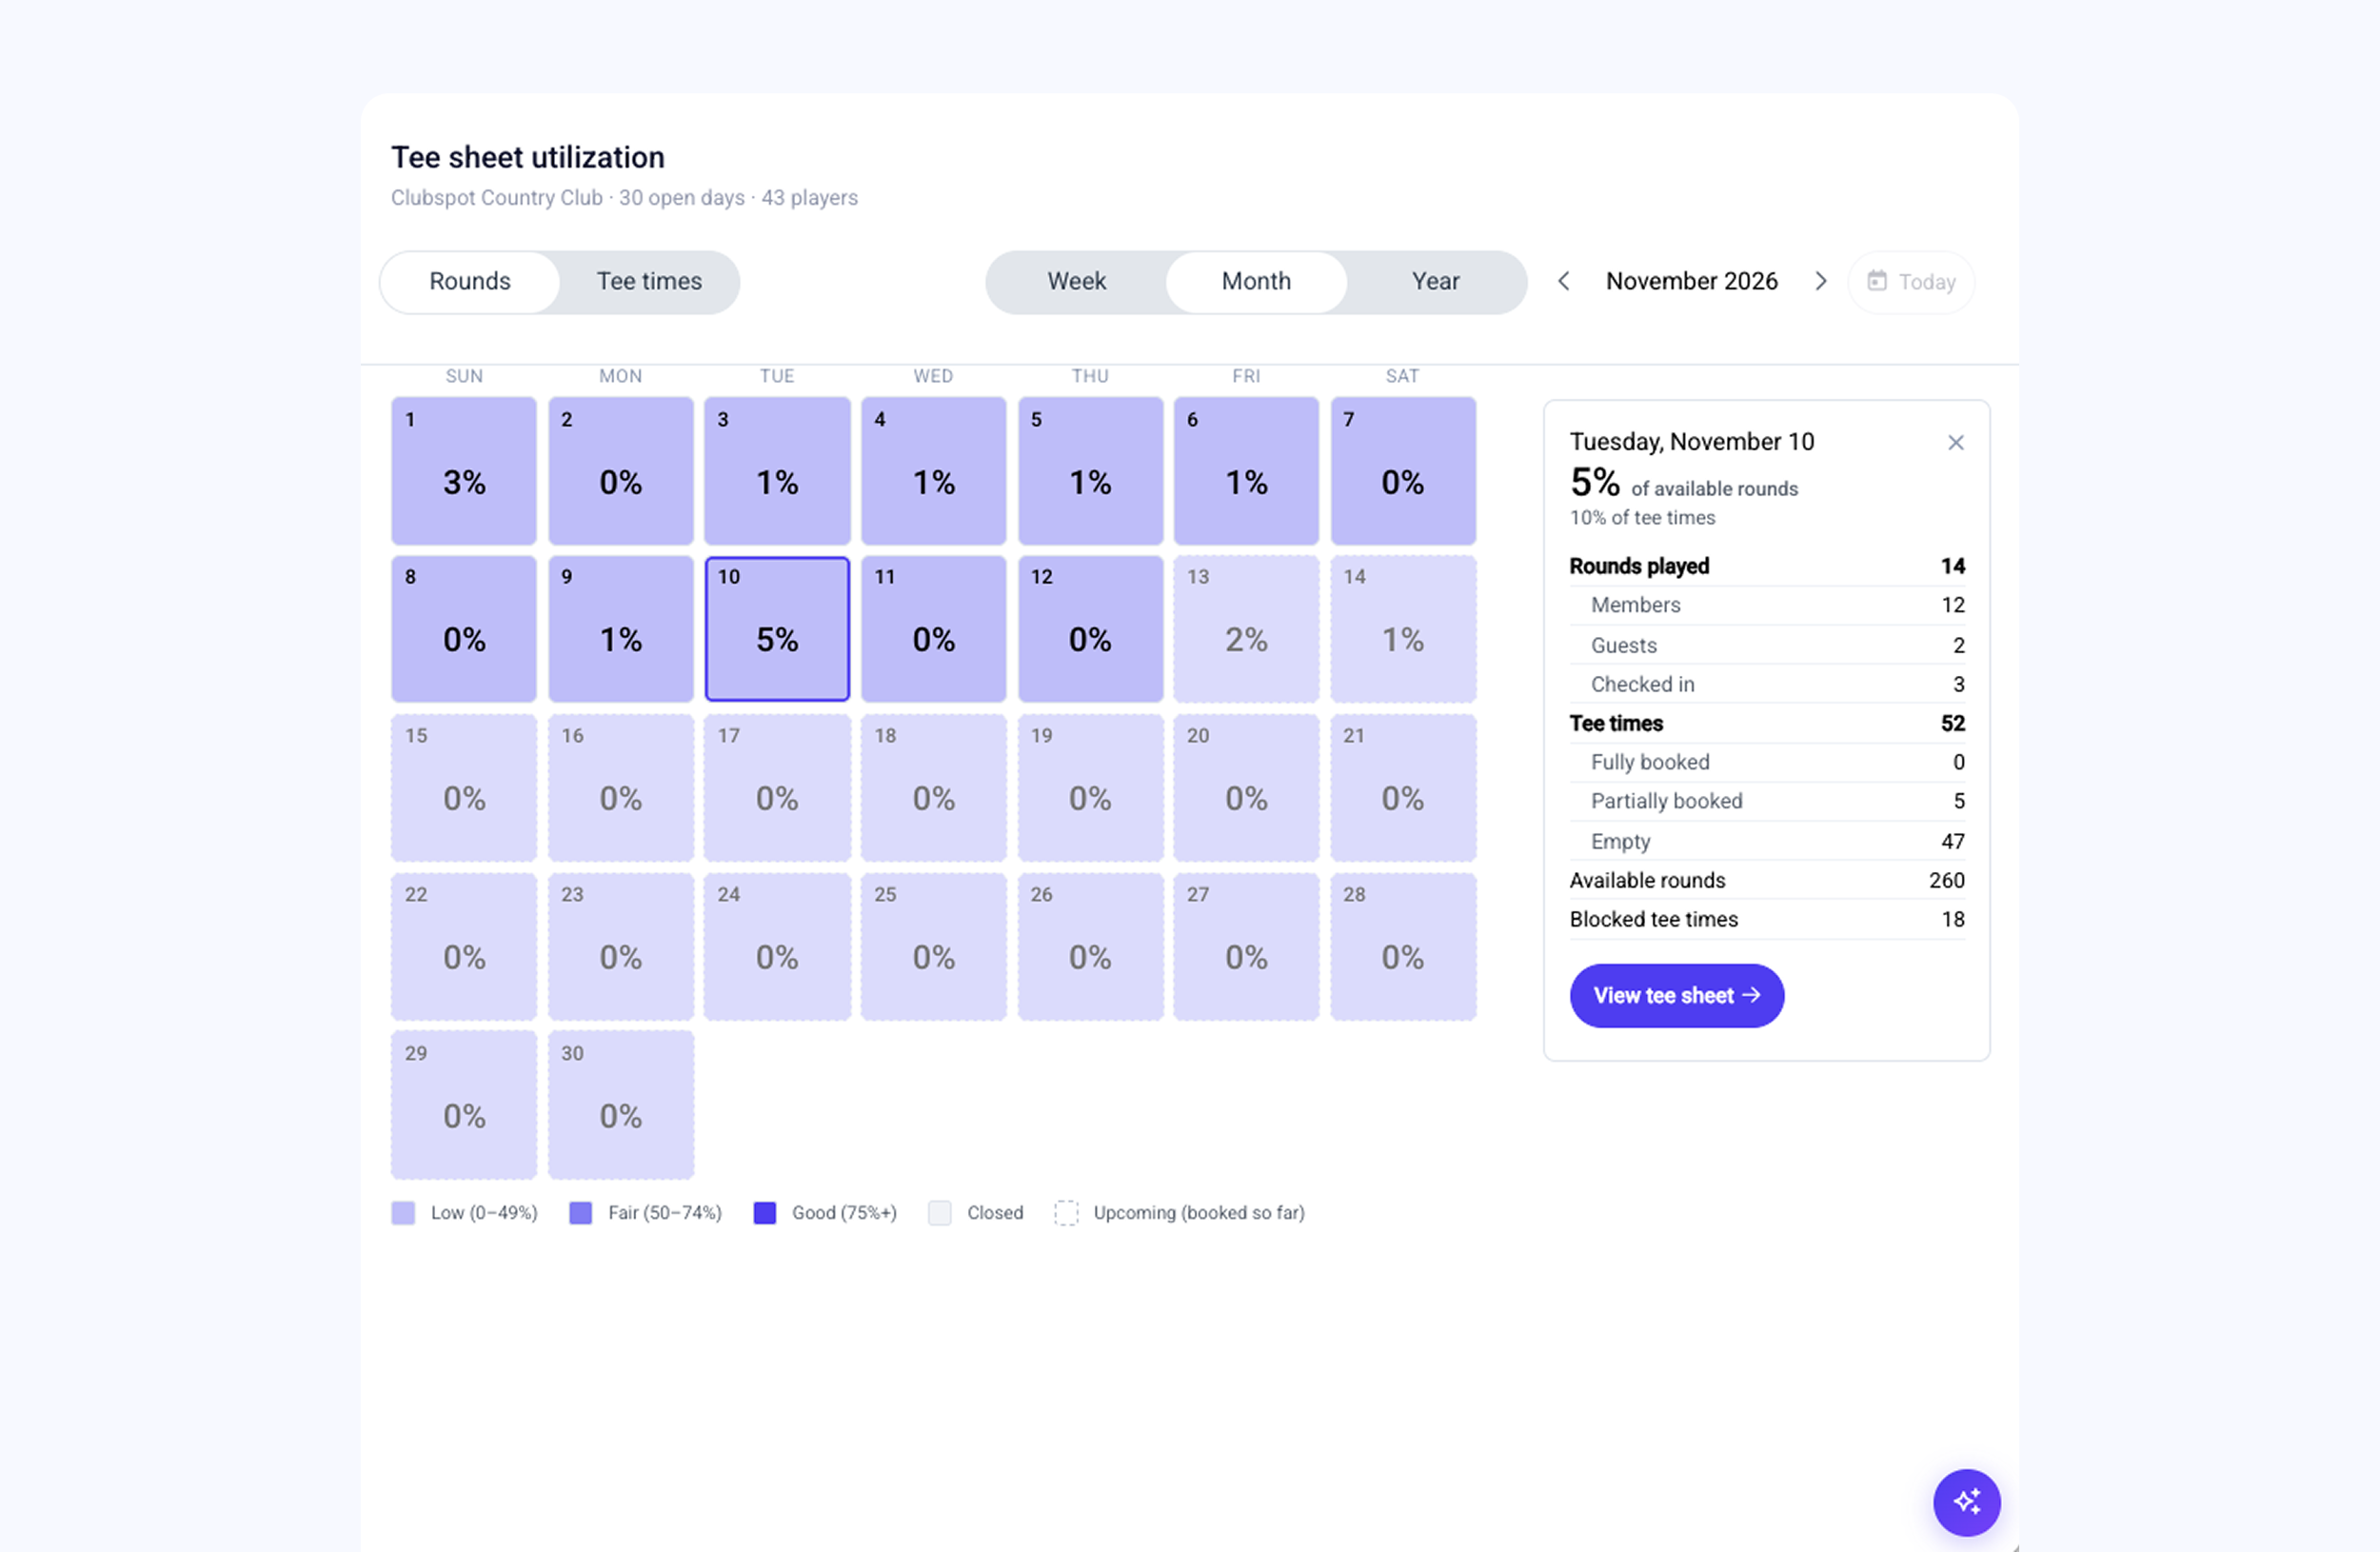
Understanding when members play gives clubs a clearer view of tee sheet demand and how course usage changes over time.
By Fritz Baldauf
A tee sheet fills and shifts throughout the season. Some days bring steady demand across the course, while others concentrate play around particular times. A busy morning on one day may look different from an afternoon rush later in the week. Seeing those patterns over time can help club teams better understand how members are using the tee sheet and where demand tends to be strongest.
Clubspot’s tee sheet utilization feature gives clubs a way to review usage by rounds or by tee times. These views offer different ways to examine activity, depending on what a team wants to understand. Week, month, and year views let staff look at a recent stretch of play, compare patterns over a longer period, or see how activity develops across the year.
Hourly weather data adds context to utilization trends for clubs in the contiguous United States with a location set on their account. Staff can view weather alongside tee sheet activity and consider how conditions and play patterns appear together over time. That context can make it easier to explore whether certain conditions coincide with changes in course usage.
The demand view focuses on which tee times are most requested on particular days during a selected period. Looking across the days of the week can help teams spot recurring peaks and quieter windows. Those patterns give staff another source of information to consider as they plan tee sheet operations and review how access is distributed throughout the day.
Clubs can configure how the utilization and demand views appear, choose which view loads by default, and set how tee times are grouped into blocks. They can also filter out tee times that fall below a selected frequency for a given time frame. This helps teams focus their review on activity that meets a threshold they choose, rather than giving equal attention to every time slot.
Settings also let clubs exclude individual shifts from the calculations. Together, these options allow teams to shape the views around their own operations and the questions they want to explore. By reviewing utilization across different time frames and using the demand view to identify recurring patterns, staff can build a clearer picture of how tee sheet activity changes throughout the week, month, and year.
Do you want to learn more about Clubspot’s tee sheet utilization? Book a demo today.
